Smart Money Concepts (SMC) and Institutional Order Flow trading, traders continually seek ways to refine their entries, reduce risk, and maximize rewards. One powerful observation has emerged within the Break and Retest Strategy (BRS): the tendency of the price to retest the 50% level of the candle that was broken during the Break of Structure (BOS).
The Classic Break and Retest Setup
The traditional BRS flow goes like this:
- Market moves bullishly, creating Higher Highs (HH) and Higher Lows (HL).
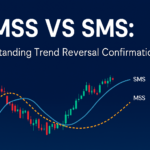
- A reversal signal appears, often through a Double Top (DT) or a confirmed Market Structure Shift (MSS).
- The MSS is confirmed when price breaks the most recent HL to the downside, creating a BOS.
- Price then retraces for a retest of the broken level before continuing the new bearish trend.

The 50% Candle Discovery
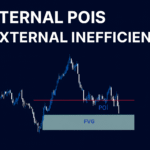
Through close observation of market behavior, a consistent pattern emerges. When the BOS occurs, price often retraces not just anywhere, but specifically to the 50% midpoint of the candle that formed the HL and was broken during the BOS.
This midpoint serves as a powerful equilibrium point—what many traders call the Mean Threshold (MT) of an order block or breaker candle. It represents a fair value level where institutions often finalize entries before driving price in the direction of the new trend.
Why the 50% Level Matters
- Institutional Precision: The 50% level often aligns with liquidity pockets where smart money executes.
- Risk Optimization: Entries from the 50% midpoint allow for tight stop losses above the swing high or order block.
- High Probability Continuation: Because this level marks the balance between buyers and sellers in that critical HL candle, retests here often fuel continuation moves.
Applying the 50% Rule in a Bearish Shift
Here’s how to structure it:
- Identify a bullish market creating HHs and HLs.
- Look for a MSS confirmed by a BOS of the most recent HL.
- Mark the bullish candle that formed that HL.
- Draw a line at the 50% midpoint of that candle.
- Wait for price to retrace to that level.
- Enter short at or near the 50% retest, with stops placed just above the candle high.
- Target the next liquidity pools (equal lows, swing lows, or inefficiencies).
Applying the 50% Rule in a Bullish Shift
Here’s the mirror image for bullish setups:
- Identify a bearish market creating Lower Lows (LL) and Lower Highs (LH).
- Look for a MSS confirmed by a BOS of the most recent LH to the upside.
- Mark the bearish candle that formed that LH (or the order block/breaker that caused the BOS).
- Draw a line at the 50% midpoint of that candle.
- Wait for price to retrace to that level.
- Enter long at or near the 50% retest, with stops placed just below the candle low (or below the OB/ breaker low).
- Target the next liquidity pools (equal highs, swing highs, or inefficiencies) or use a fixed RR.
Practical Notes
- Body vs range: choose one method (body midpoint or high–low midpoint) and apply it consistently.
- Displacement filter: prefer setups where the BOS shows clear displacement (a wide-range or imbalanced break).
- Confluence: the 50% level gaining confirmation from HTF structure, volume profile nodes, or nearby order blocks improves probability.
- Stop placement: using the OB/breaker extremes usually reduces false entries caused by wicks.
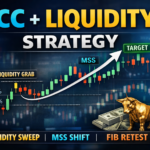
High-Probability Confluence with Volume Profile
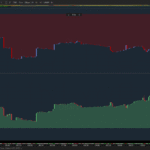
A major refinement to this entry model is combining it with POC (Point of Control) or High Volume Node (HVN) confluence. When the 50% retest after a strong BOS displacement aligns with a POC/HVN, the continuation often becomes exceptionally powerful. The logic is:
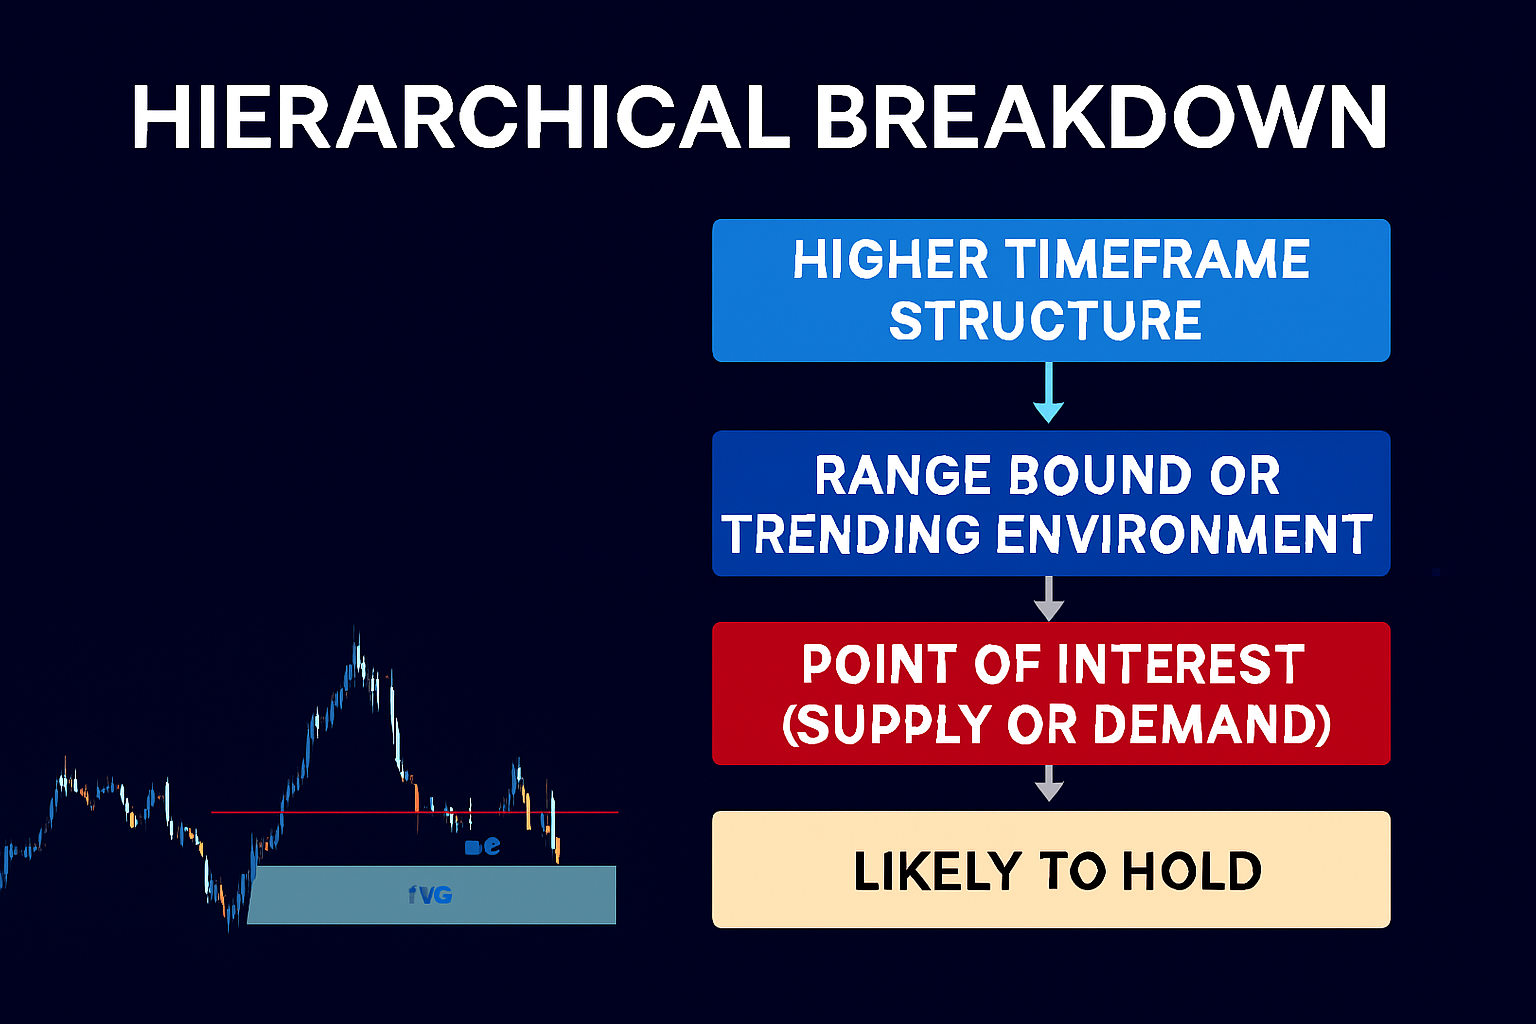
- Directional Bias: Ensure price has not yet reached a higher-timeframe discount demand zone (in bearish shifts) or a premium supply zone (in bullish shifts). This keeps trades aligned with HTF flow.
- Displacement: A strong BOS candle signals institutional participation and leaves behind inefficiencies (FVGs) that often get mitigated.
- Volume Confluence: The 50% level overlapping with POC or HVN confirms institutional order flow is concentrated at that zone.
Probability & RR Profile
- Probability boost: Displacement + Volume Profile (POC/HVN) + HTF alignment = significantly higher win rate.
- RR boost: Since entry is deep in mitigation with a tight stop, 3R–6R is realistic, sometimes even 10R+ when continuation runs clean.
Trade Example (Bearish Setup)
- HTF bias = bearish, price not yet in HTF demand.
- BOS of last HL with clear displacement (wide candle, imbalance).
- Mark 50% of the HL candle.
- Check VP → HVN/POC aligns near the 50%.
- Enter short on retest.
- Stop above HL candle high.
- Target = equal lows / discount zone liquidity.
Result = high confidence, clean RR, strong continuation.
This stacking of confluences provides very high-probability setups with asymmetric reward-to-risk, often producing 3R–6R or more. Stops remain tight above/below the BOS candle extreme, while targets extend into opposing liquidity pools, equal highs/lows, or HTF zones.
Conclusion
This simple yet effective tweak to the Break and Retest Strategy—using the 50% midpoint of the BOS candle—can significantly sharpen trade entries in both bearish and bullish shifts. It provides a mechanical, rule-based method to capture institutional-level precision across market directions. For traders looking to add a refined edge to their Smart Money Concepts toolkit, the 50% candle rule is a compact and practical tool. This simple yet effective tweak to the Break and Retest Strategy—using the 50% midpoint of the BOS candle—can significantly sharpen trade entries. It provides a mechanical, rule-based method to capture institutional-level precision in both bullish-to-bearish and bearish-to-bullish shifts. For traders looking to add refinement to their Smart Money Concepts playbook, this observation is a game-changer.