One of the most frustrating experiences in trading is watching price respect your demand zone… only briefly—before breaking through it and moving strongly in the opposite direction.
At first glance, it feels like the setup simply “failed.”
But what if it didn’t fail?
What if it did exactly what it was supposed to do?
The Hidden Truth About Demand Zones
Most traders are taught that demand zones represent areas where institutions have placed buy orders. The expectation is simple:
Price returns → demand holds → price rallies
However, the market is not designed to reward obvious setups.
In reality, many demand zones serve a different purpose:
They act as inducement zones.
These zones:
- Attract early buyers
- Create liquidity (stop losses below)
- Give the illusion of support
- Set up the real move
Case Study: When Demand Becomes a Trap
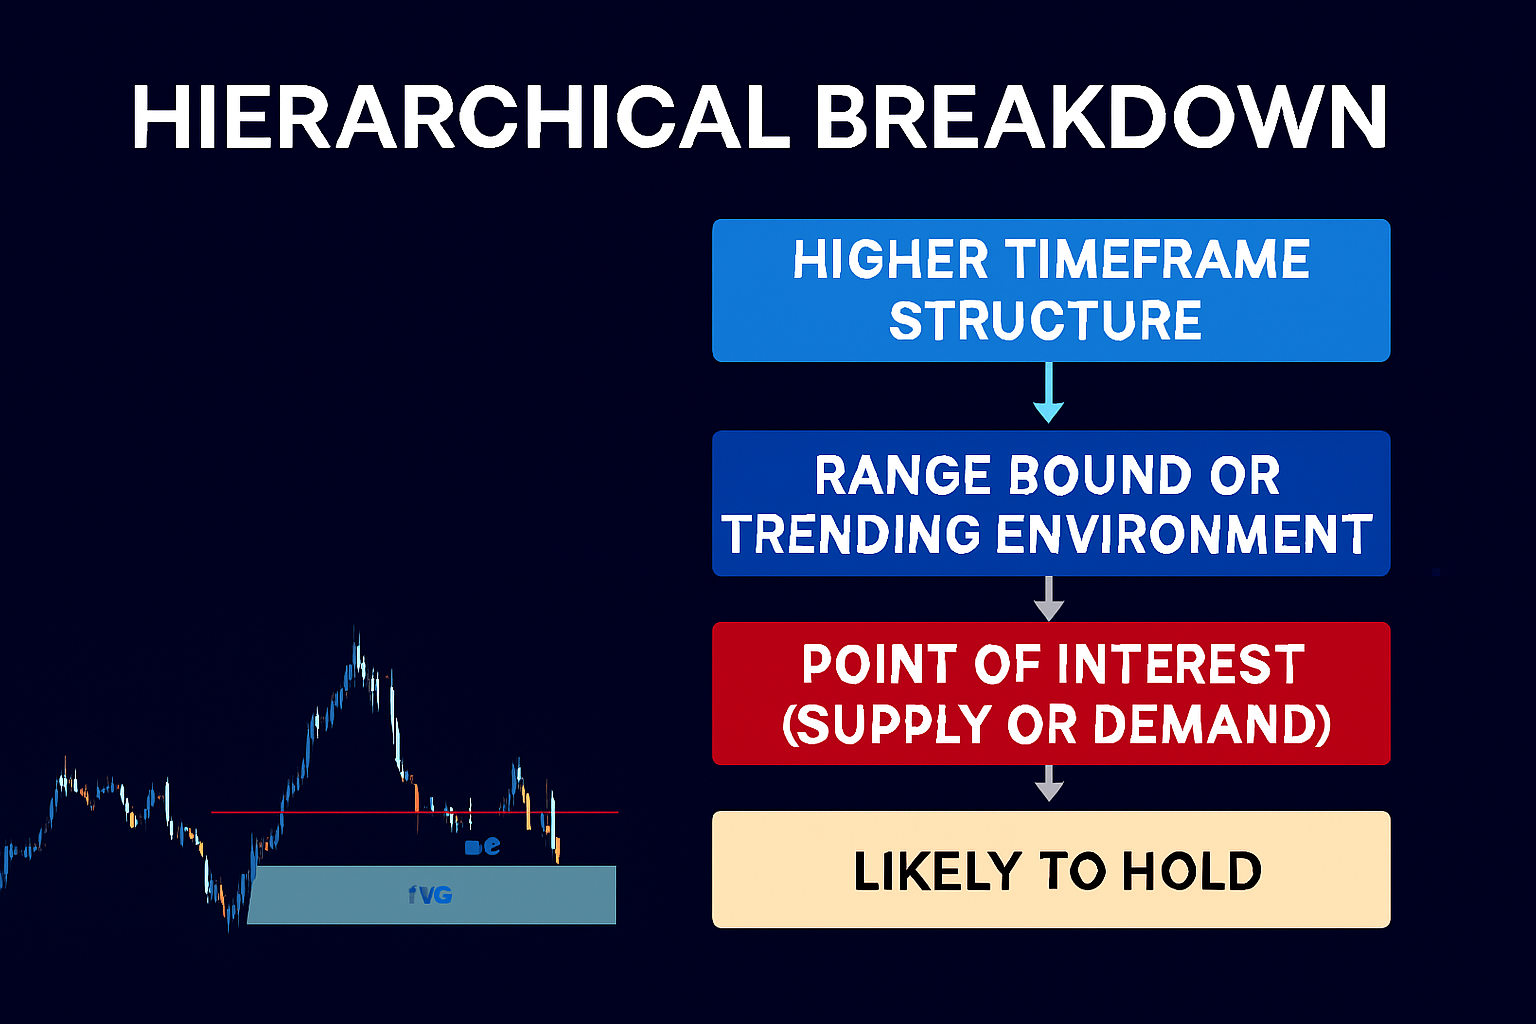
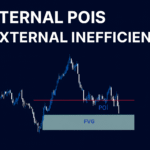
Looking at the chart in the provided image:
- Price reacts cleanly from a marked demand zone
- Traders enter long positions expecting continuation
- A small bounce validates their bias
But then:
- Price breaks through the demand zone decisively
- It continues downward toward a lower key level
This reveals something critical:
The demand zone was not the destination—it was the bait.
What Is the Real Target?
Below the demand zone lies a key level:
- A previous resistance
- A known turning point in the market
- A structural pivot
These levels are powerful because they:
- Hold historical significance
- Contain trapped traders
- Offer deeper liquidity for large orders
Why Key Levels Act as Price Magnets
Unlike standard demand/supply zones, key levels:
1. Represent True Market Decisions
These are not minor imbalances—they are points where the market made a major shift.
2. Accumulate Liquidity
Breakouts, stop losses, and pending orders cluster around these zones.
3. Attract Institutional Activity
Large players need volume. Key levels provide it.
4. Align Across Timeframes
A key level on a higher timeframe carries far more weight than a lower timeframe demand zone.
The Real Market Mechanism
The sequence often looks like this:
- Price approaches a demand zone
- Traders enter long positions
- Price reacts slightly (confirmation)
- More traders pile in
- Liquidity builds below the zone
- Price sweeps the zone
- Price moves toward the true target: the key level
The Shift in Perspective
Instead of asking:
“Why did my demand zone fail?”
Ask:
“Was this zone used to reach a deeper objective?”
This shift transforms your trading from reactive to strategic.
Practical Takeaway
- Treat demand/supply zones as potential inducement, not guarantees
- Always identify higher-timeframe key levels
- Look for where liquidity is resting—not just where price reacted before
- Understand that the market often moves through obvious zones to reach meaningful ones
Final Thought
The strongest levels in the market are not always the most visible ones—they are the ones that attract liquidity.
And sometimes, the level you trust the most is simply the tool price uses to reach the level that truly matters.
Case Study: US100 – Demand Zone as Inducement into a Key Level
Let’s break down the exact scenario observed on the US100 (Nasdaq) 2H chart.
1. Market Context
Price was trending within a descending channel, consistently making:
- Lower highs
- Lower lows
This already suggests bearish pressure and increases the probability that demand zones will be weaker or used as inducement rather than true reversal points.
2. The Demand Zone Formation
A demand zone formed after a sharp bullish reaction:
- Price left the zone impulsively
- This created the appearance of institutional buying
- Traders naturally marked this as a high-probability long area
When price returned:
- It respected the zone briefly
- Printed a reaction
- Encouraged buyers to enter
At this point, everything looked valid.
3. The Inducement Phase
However, this is where the real mechanism begins:
- The reaction from the demand zone was not continuation—it was inducement
- Buyers entering here placed their stop losses just below the zone
- This created a pool of liquidity beneath the demand
Additionally:
- Multiple Fair Value Gaps (FVGs) above showed inefficiencies being partially respected
- But price kept forming lower highs, confirming bearish intent
4. The Real Target: The Key Level Below
Below the demand zone sat a clearly defined key level:
- A previous major turning point (pivot)
- A level where price had strongly reacted in the past
- A zone likely visible even on higher timeframes
This level had:
- More liquidity
- More historical relevance
- More institutional interest
5. The Liquidity Sweep
Price then:
- Broke below the demand zone aggressively
- Swept all resting stop losses
- Accelerated into the key level
This move confirms:
The demand zone was not meant to hold—it was engineered to facilitate the move into the key level.
6. Confluence with Structure
Additional confirmations that strengthen this read:
- The move aligned with the descending trendline resistance
- Each rally into FVGs resulted in continuation downward
- The final push formed a strong displacement candle into the key level
7. Key Lesson from This Setup
This case study highlights a critical shift in understanding:
- Demand zones inside a bearish structure are often liquidity tools, not reversal zones
- True reactions are more likely at major structural pivots (key levels)
- Inducement is not random—it is part of the delivery mechanism of price
Final Insight from the US100 Example
Instead of viewing the demand zone as a failed setup, it should be seen as:
A necessary step the market used to gather liquidity before reaching its true objective.
This is the difference between:
- Trading zones mechanically
vs - Understanding the intent behind price movement