Most retail traders analyze markets using price over time — candlesticks, indicators, and chart patterns. However, professional and institutional traders often focus on something more important:
👉 Volume traded at specific price levels.
This is where the Anchored Volume Profile (AVP) becomes a powerful trading tool. It allows traders to identify high-probability pullback entries inside strong trends, especially when combined with the 50%–61.8% Fibonacci retracement zone.
This article explains:
- What Anchored Volume Profile is
- Why volume per price matters more than volume per time
- How to combine AVP with Fibonacci retracements
- A real chart case study
- Why this method improves risk-to-reward
What Is Anchored Volume Profile?
Anchored Volume Profile (AVP) is a volume-based trading indicator that displays the distribution of trading volume across price levels, starting from a user-defined anchor point (such as a major swing high or swing low).
Unlike traditional volume indicators that measure volume per candle or time period, AVP measures:
Volume per price level
This allows traders to identify:
- High-Volume Nodes (HVN): price levels where heavy trading occurred
- Low-Volume Nodes (LVN): price levels where price moved quickly
- Value areas and rejection zones
- Institutional accumulation and distribution zones
In short:
Anchored Volume Profile shows where large market participants have committed capital.
Why Volume Per Price Is More Important Than Volume Per Time
Traditional volume indicators answer:
“How much volume traded during this candle?”
Anchored Volume Profile answers:
“At which price did most trading activity occur?”
Markets do not remember time — they remember price.
High-volume price levels often act as:
- Support in uptrends
- Resistance in downtrends
- Re-entry zones during pullbacks
This makes AVP extremely effective when trading retracements within trends.
The Importance of the 50%–61.8% Fibonacci Retracement Zone
In trending markets, price rarely moves in a straight line. Strong trends usually retrace into the:
- 50% Fibonacci retracement
- 61.8% Fibonacci retracement
This area is commonly known as:
- Discount zone in uptrends
- Premium zone in downtrends
Institutional traders use this zone to:
- Add to existing positions
- Re-accumulate during pullbacks
- Enter with favorable risk-to-reward
However, Fibonacci retracements alone do not provide enough confirmation. This is where Anchored Volume Profile adds precision.
Why AVP and Fibonacci Work Best Together
When the 50%–61.8% Fibonacci retracement overlaps with:
- A High-Volume Node from AVP
- A previous consolidation area
- A key market structure level
You get a high-probability pullback zone with:
✅ Trend continuation bias
✅ Evidence of institutional participation
✅ Clear invalidation level
✅ Favorable risk-to-reward
Instead of chasing price breakouts, this method allows you to enter trades at areas of previous market acceptance.
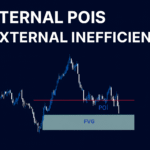
Case Study: NZD/CHF Trend Pullback Using Anchored Volume Profile

On the NZD/CHF chart:
- The market is in a clear uptrend (higher highs and higher lows).
- Anchored Volume Profile is applied from the major swing low.
- A significant high-volume node forms within the trend.
- Price pulls back into:
- The 50%–61.8% Fibonacci retracement zone
- The Anchored Volume Profile high-volume node
- A previous support structure
This creates a strong confluence zone where:
- Buyers previously showed strong interest
- Volume confirms price acceptance
- Risk can be clearly defined
Trade Concept:
- Entry: Inside the 50–61.8% retracement overlapping the AVP high-volume node
- Stop loss: Below the volume node and structure support
- Target: Prior highs or trend continuation
This setup provides:
✔ Lower drawdown
✔ Clear invalidation
✔ Larger reward potential
✔ Logical price behavior
How This Strategy Improves Risk-to-Reward
Many traders enter trends too early or chase price after breakouts.
Using Anchored Volume Profile with Fibonacci retracements:
- Forces patience
- Keeps you aligned with the trend
- Improves stop placement
- Reduces emotional trading
- Increases reward-to-risk ratio
Instead of buying highs, you buy:
Where the market previously found value.
Key Benefits of Anchored Volume Profile Pullback Trading
- Identifies institutional price levels
- Filters low-probability Fibonacci setups
- Improves trade location
- Works across forex, indices, and crypto
- Provides objective support and resistance
Key Takeaway!
Most traders focus on candlesticks.
Professional traders focus on where volume accumulated.
When you combine:
✔ Market structure
✔ Fibonacci retracement
✔ Anchored Volume Profile
You stop guessing and start trading based on market memory.
Price moves through time…
but it reacts to price levels where volume lives.
Thank you for reading this article , leave a comment if you learned something usefull.